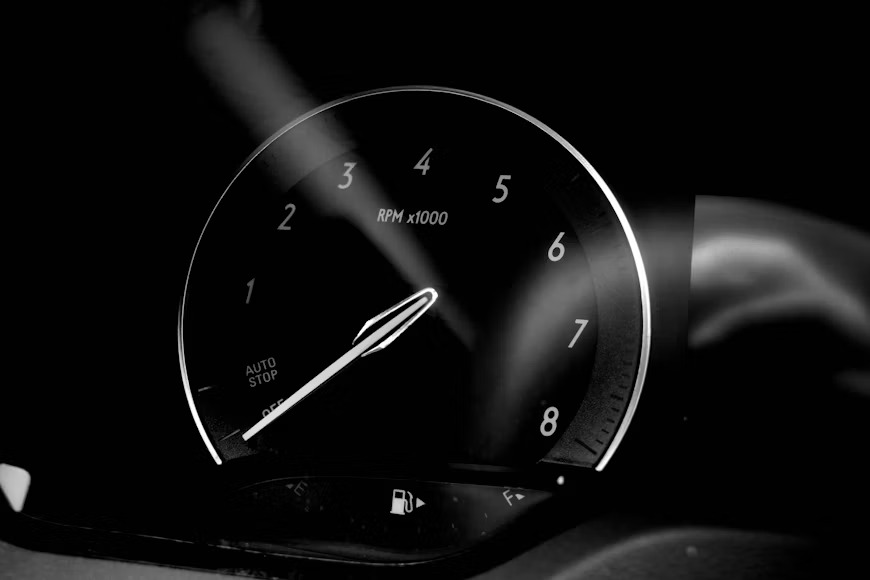
Torque is the twisting force. Power measures how quickly that torque can do work. The gearbox trades speed for torque before the force reaches the tyres, which is why a peak engine-torque figure cannot settle which car will accelerate harder.
The 30-second answer
An engine or motor produces torque at its shaft. The transmission and final drive multiply that torque, and the tyres turn the resulting wheel torque into force against the road. That force accelerates the car.
Power answers a different question: how quickly can the drivetrain keep doing that work? In a rotating system, power is torque multiplied by angular speed. A power figure therefore contains both how hard the shaft twists and how fast it is turning. BIPM SI Brochure
The cleanest conclusion is not that one number wins. Wheel torque produces acceleration; available power determines how much wheel torque gearing can deliver at a given road speed. Weight, grip, aerodynamic drag, gearing, tyre radius and drivetrain losses then decide what the whole car can do.
RPM is the number missing from torque
Suppose an engine produces 200 N·m. That does not tell us its power until we also know the engine speed. In metric units, power in kilowatts equals torque in newton metres multiplied by RPM, divided by approximately 9,549.
At 2,000 RPM, 200 N·m is about 41.9 kW. At 6,000 RPM, the same torque is about 125.7 kW—three times the power because the shaft performs the same twist three times as often.
That is why a high-revving engine can make more power than an engine with a larger torque peak. The first engine may use a shorter gear at the same road speed, multiplying its lower engine torque into greater torque at the wheels.
Unit labels matter as well. NIST lists metric horsepower at about 735.5 watts and mechanical horsepower at about 745.7 watts. European PS, CV and Danish hk commonly refer to metric horsepower, while US hp commonly means mechanical horsepower. Comparing the naked number without checking the unit introduces a difference of about 1.4 per cent before the cars have even moved. NIST conversion factors
The famous 5,252 constant is not a special engine speed. It is the conversion factor in the imperial formula: horsepower equals pound-feet multiplied by RPM, divided by 5,252. Change the units and the constant changes; with N·m and kW, it is approximately 9,549.
Engine torque is not wheel torque
A gearbox is a lever made from gears. Ignoring losses, it cannot create power, but it can exchange speed for torque. UC San Diego’s gear-ratio explanation expresses the same relationship: lower output speed permits higher output torque. UC San Diego gear-ratio lesson
Take a hypothetical engine producing 250 N·m. With a 3.5:1 first gear, a 4.1:1 final drive and an assumed 90 per cent driveline efficiency, the axle receives roughly 3,229 N·m. With a 1:1 gear at the same engine torque, it receives about 923 N·m.
On a driven tyre with a 0.32-metre effective radius, those figures correspond to approximately 10,090 N and 2,883 N of idealised tractive force. The calculation is simplified—real tyres deform, grip is finite and losses vary—but it shows why the engine’s advertised torque is not the force available at the road.
This is also why the claim that torque wins races is incomplete. The car accelerates because of force at the tyres, not because one brochure printed the larger crankshaft-torque number.
Why power predicts acceleration across the gears
Within one fixed gear, and before drag or traction dominate, acceleration broadly rises and falls with engine torque because the gear ratio is fixed. That is the part people feel as the engine moves through its torque curve.
At a fixed road speed, however, the driver may be able to choose between gears. A lower gear raises engine RPM and multiplies torque more strongly. The engine that can maintain useful torque at higher RPM makes more power and can exploit that more aggressive ratio.
Another way to see it is that power equals force multiplied by speed. At a given road speed, more delivered power permits more tractive force. At very low speed the tyres may be unable to use all of it; at high speed aerodynamic drag consumes an increasing share. Power-to-weight, gearing and grip are therefore more informative for broad acceleration than either peak engine figure alone.
SAE’s J2908 measurement report also distinguishes source-system power from wheel power and states that wheel power is lower because the drivetrain consumes some power. The comparison point matters: crankshaft output, motor output and wheel output are not interchangeable figures. SAE J2908
The best shift point is not one magic RPM
For maximum acceleration, do not automatically shift at peak torque. Do not assume the exact peak-power RPM or redline is always correct either.
The useful rule is to compare wheel force in the current gear with wheel force after the upshift at the same road speed. Shift when staying in the current gear would deliver less wheel force than the next gear. Because an upshift drops engine RPM, the best point is often after peak power and sometimes near redline, allowing the engine to land back in the stronger part of its power band. A sharply falling power curve or a close ratio can move that point earlier.
Calculating the exact point requires the torque or power curve, individual gear ratios, final drive and tyre size. For ordinary road driving, maximum acceleration is rarely the objective; the owner’s manual, traffic conditions, mechanical sympathy, noise and fuel use matter more.
Why torque changes with RPM
The crank radius does not change, but the force acting through it does. As RPM changes, so do the amount and motion of air entering the cylinders, valve-timing effects, intake and exhaust pressure waves, turbocharger response, ignition or injection timing, combustion quality, heat transfer and mechanical friction.
An engine may breathe efficiently through the middle of its range, then lose torque as airflow or valve events become limiting and friction rises. Variable valve timing, tuned intake runners and boost control are among the tools engineers use to reshape that curve. MIT’s internal-combustion-engine course treats operating characteristics, intake and exhaust processes, friction and turbocharging as separate parts of the same output problem. MIT OpenCourseWare
That is why peak torque must be accompanied by an RPM, and why a curve is more useful than a single value. Vehicle regulations likewise require measurements at enough engine speeds to define the power and torque curves, including the speeds of maximum torque and maximum power. UNECE power-testing requirements
Towing and hills: low-end response is useful, but it is not the rating
Strong torque at low RPM can make a vehicle feel relaxed. It may pull away with less engine speed and climb a modest gradient without an immediate downshift. That is a real drivability benefit, especially when the useful output is spread across a broad rev range.
But towing a load uphill at speed requires sustained power. The gearbox can multiply torque for the wheels, while the engine or motor must keep supplying enough power to lift the combined mass and overcome rolling and aerodynamic resistance. A high torque peak alone says nothing about cooling capacity, brakes, chassis loads, legal towing limits or how long the powertrain can sustain its output.
The practical buying rule is simple: use the manufacturer’s rated towing capacity for the exact vehicle and configuration, then consider the torque curve, gearing and cooling system for how comfortably it will perform the job. Do not calculate a safe trailer weight from horsepower or torque.
Diesel, petrol and electric cars feel different for a reason
Many diesel engines produce strong torque at relatively low RPM and operate over a narrower rev range. Many petrol engines trade some low-speed torque for more RPM, while turbocharging and variable valve systems can flatten either curve. The fuel label alone does not decide the result; compare the complete curves and gearing.
Electric traction motors add another useful correction. They can produce substantial torque from zero shaft speed and controllers can respond quickly, so the initial shove may arrive without waiting for an engine to reach a particular RPM or a gearbox to downshift. Yet mechanical power at exactly zero RPM is still zero, because power equals torque multiplied by angular speed. As speed rises, the motor and inverter meet torque, power, voltage, current and thermal limits. The US Department of Energy describes the power-electronics controller as the system that manages motor speed and torque. US Department of Energy
How to compare two cars without being misled
Start with the job. For maximum acceleration, compare tested acceleration, power-to-weight, the usable power curve, gearing and grip. For towing, start with the rated capacity and configuration, then inspect low-speed response and thermal capability. For everyday driving, the width and location of the useful power band may matter more than either peak.
- Are the figures measured in the same units and under comparable standards?
- Do they describe engine or motor output, or power and torque at the wheels?
- At what RPM do the peaks occur, and how broad is the useful curve?
- What are the vehicle mass, gear ratios, final drive, tyre size and driven wheels?
- Is the real question already answered by a relevant test—0–100 km/h, overtaking time, gradeability or rated towing capacity?
SAE J1349 exists to make installed engine power and torque measurements repeatable and representative of customer service rather than a best-case laboratory trick. Even so, a certified engine peak remains only one input to whole-vehicle performance. SAE J1349
The shortest honest answer is this: torque describes the twist, power describes how quickly the twist can keep doing work, and gearing decides how that work reaches the road. If someone offers only one peak number, the useful question is not whether it sounds large. It is: at what RPM, through which gear, in what vehicle, and for what job?
Sources
- Engineering Explained: Horsepower vs Torque — A Simple Explanation
- BIPM: The International System of Units
- NIST Guide to the SI: conversion factors
- SAE J1349: Engine Power Test Code
- SAE J2908: Vehicle Power and Rated System Power Test
- UNECE power-testing requirements
- UC San Diego: Gear Ratios
- MIT OpenCourseWare: Internal Combustion Engines
- US Department of Energy: How all-electric cars work
- Lead photograph by Nathan Q on Unsplash