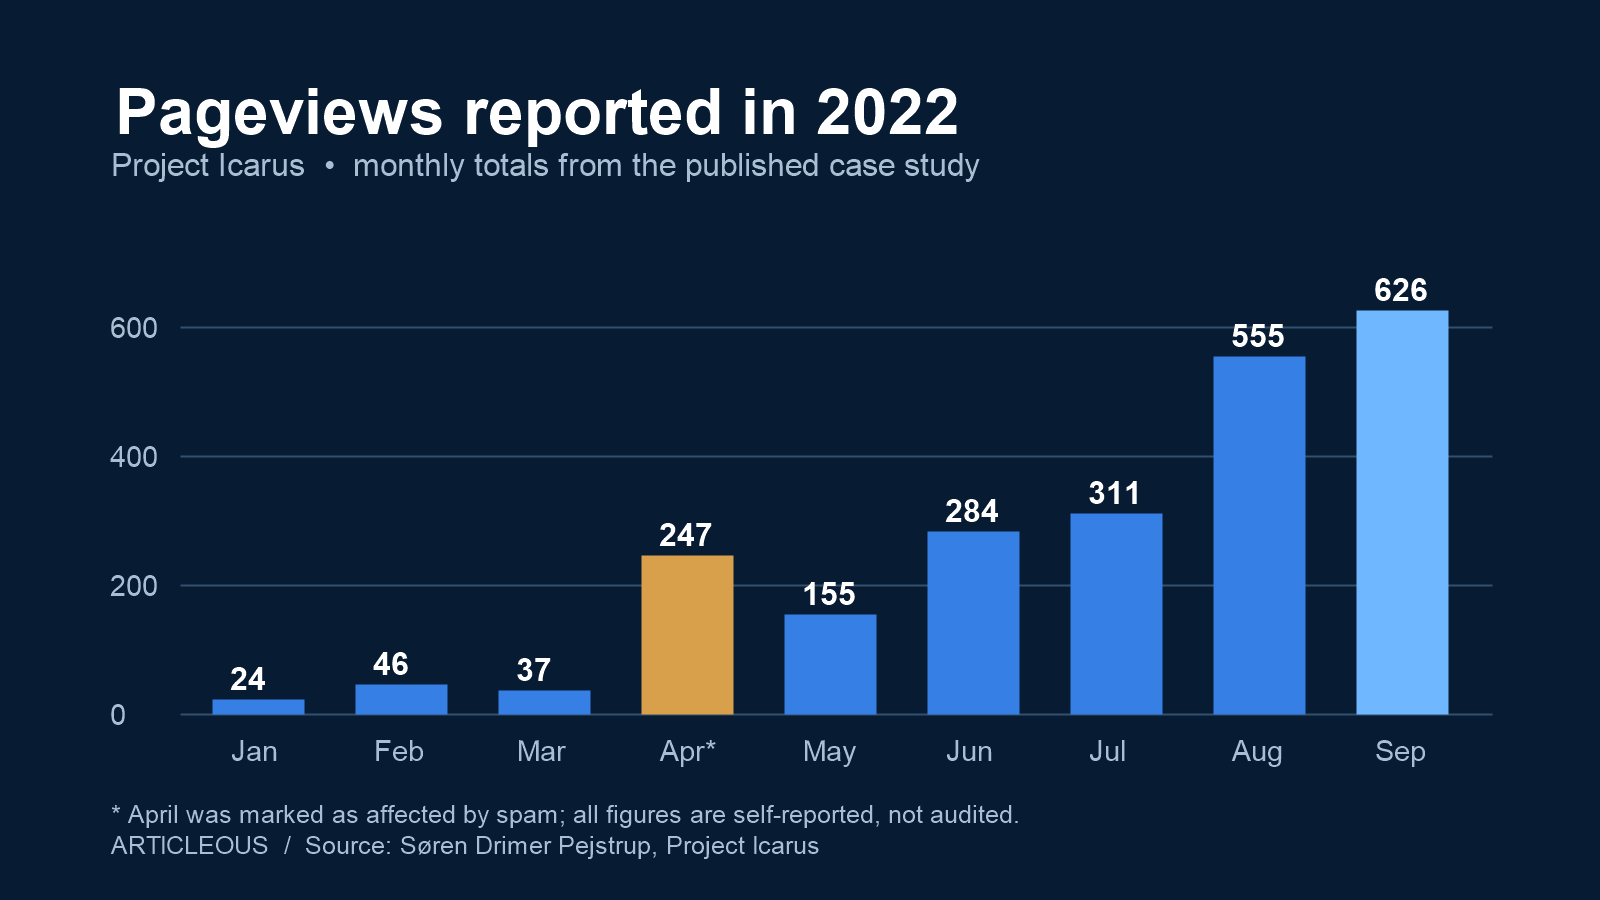
By September 2022, a small website in Søren Drimer Pejstrup’s Project Icarus experiment had published 67 articles and recorded 626 monthly pageviews. The reported earnings were $6.33. That was a real first return, but a long way from the project’s $500-a-month goal. The more useful story is what the numbers can establish, and what a nine-month, self-reported case study cannot.
The result is smaller and more useful than a success story
Pejstrup described the project as a test of whether a new site could attract search visitors and earn meaningful income. His published account gives month-by-month article counts, pageviews and earnings through September 2022. The target was $500 per month. The final reported month reached a little over one percent of that revenue goal. An honest reading has to hold both facts together: the site began earning, and the available record does not demonstrate a viable business. Archived Project Icarus report
The account is a first-person report, not an audited dataset. We have not accessed the underlying analytics property, ad account, article-level reports or expenses. Its screenshots and tables are evidence of what the creator published, but they cannot independently establish the accuracy of every measurement. The site’s niche is also undisclosed in the account, preventing a serious comparison with another topic or publisher.
That limitation does not make the record worthless. Most “start a blog” advice skips the awkward interval between publishing a large batch and seeing meaningful traffic. Here we can examine the gap, the denominators and the events that disturb them. The lesson is a method for reading an experiment, not a promise that copying its publishing schedule will produce the same result.
What the monthly record actually says
The original article gives the following cumulative article counts and monthly pageviews. Earnings are reported in US dollars. April needs an asterisk: Pejstrup says that month’s traffic included spam after a compromised website backup affected sites on his shared hosting. The table should not be read as nine clean months of human readership.
| 2022 month | Articles reported | Pageviews reported | Earnings reported |
|---|---|---|---|
| January | 1 | 24 | $0 |
| February | 2 | 46 | $0 |
| March | 2 | 37 | $0 |
| April* | 2 | 247 | $0 |
| May | 62 | 155 | $0 |
| June | 64 | 284 | $0.31 |
| July | 64 | 311 | $5.10 |
| August | 64 | 555 | $7.37 |
| September | 67 | 626 | $6.33 |
The large publication jump occurred in May: the reported total rose from two articles to 62. Pageviews were 155 that month and 626 in September, roughly four times May’s figure. Those are small absolute numbers, however. They do not identify how many visits came from search, which pages attracted them, whether the same people returned, or how much production cost. Nor can the April spike be used as evidence of an earlier search breakthrough.
The September line is especially revealing. Pageviews climbed from 555 in August to 626 in September, while reported revenue fell from $7.37 to $6.33. Both numbers can be true. Ad returns can vary independently of pageviews, and the account gives no breakdown that would let us assign a cause. Calling that month “traffic up, earnings down” is sound description. Naming a particular Google update or ad-market shift as the cause would go beyond the evidence supplied.
Indexing was a milestone, not the business result
Pejstrup wrote that all 62 articles were indexed in May. That is his reading of Search Console at the time, supported in the post by screenshots rather than a downloadable URL-level export. Even if every URL was indexed, it would establish that Google had processed those pages, not that the pages appeared prominently for useful queries or brought paying readers. Google now describes crawling, indexing and serving search results as distinct stages, and says inclusion in its index does not guarantee visibility in results. Archived Project Icarus indexing claim Google Search Central: how Search works
A useful follow-up would compare the exact URLs’ indexing status with search impressions, clicks and query data over the same period. Search Console measures search-result exposure and clicks, while an analytics pageview counts a loaded page under the site’s own measurement setup. A pageview may come from direct traffic, a newsletter, social media, the owner’s own testing or elsewhere. The published monthly table does not connect those streams.
Google’s Search Console documentation also warns that totals change depending on whether the Performance report groups results by property or by page. That matters if a creator later tries to match a site-wide chart to a URL table. An apparent mismatch may come from counting rules rather than disappearing traffic. The Project Icarus post does not provide enough raw reporting detail to reconcile its screenshots at that level. Google Search Console data aggregation
The practical lesson is to name the metric when celebrating progress. “62 pages indexed,” “626 pageviews,” “organic search clicks,” and “$6.33 in ad earnings” are four different claims. Each requires its own source, period and denominator. A single rising blue line should never have to carry them all.
The batch of 60 cannot prove that batching works
The original plan compared six ways of finding article ideas, including zero-volume terms, the Keyword Golden Ratio and two commercial keyword tools. Pejstrup wanted a prospective test: choose topics by different methods, publish, then see which approach performed. That is a better question than looking at a winning page afterwards and declaring its length or keyword score the cause of success.
But the published nine-month record does not provide results by method. We do not know how many articles belonged to each group, when each page went live, what queries each targeted, or whether their quality and competition were comparable. We also lack a similar site that released articles gradually instead of as one May batch. From the table we can say publication volume jumped; we cannot say the jump caused the later traffic rise, let alone that publishing 60 at once beats publishing a few each week.
The time lag is real in the record but remains ambiguous. May had 62 articles and 155 pageviews; September had 67 and 626. New pages can be discovered and served over time, but the account cannot isolate that mechanism from later edits, seasonality, links, changes in search demand or residual measurement problems. Treat “publish in a batch and wait four months” as a hypothesis this case raises, not an instruction it validates.
For another publisher testing an article strategy, the useful upgrade would be to record each page’s publish date, intended reader question, topic group, production time and any later revisions. Compare impressions and clicks per page after a defined interval, such as 30, 90 and 180 days, while noting that these are observations rather than a randomized trial. The point is not to make a tiny business experiment look like laboratory science. It is to preserve enough detail to avoid explaining every change after the fact.
The malware episode changes the baseline
The creator says he restored an acquired site from a backup containing spam and that the problem affected eight sites sharing his hosting, including the experimental one. We could not verify the incident with server logs or security reports, so it remains an attributed account. It is still relevant to the figures: he himself labels April’s 247 pageviews with a spam warning and describes a disruption to Search Console’s valid-URL chart.
That makes April a poor baseline for judging whether readers were arriving. The sequence 37 pageviews in March, 247 in April, then 155 in May might look like a collapse after the 60-article release. Once April is marked as contaminated, that simple story loses its basis. A clean comparison needs a traffic source report and a documented interval after remediation, neither of which is in the public case study.
The security detour also illustrates a cost that traffic tables hide. Time spent diagnosing a compromised installation, reviewing backups and checking other hosted sites is work. A project can report a few dollars of ad revenue while absorbing many hours of unpaid maintenance. In a small experiment, those hours can dominate any income. We cannot calculate this project’s profit because its labour, hosting, content and cleanup costs were not disclosed.
Revenue per pageview is a description, not a forecast
The original business target assumed $12 to $15 in earnings per thousand visitors, then translated a $500 monthly goal into tens of thousands of visits. The September data invite a more modest calculation: $6.33 divided by 626 pageviews, multiplied by 1,000, is about $10.11 per thousand pageviews. August’s $7.37 divided by 555 pageviews is about $13.28. These are simple ratios of the reported totals, not verified ad-platform EPMV figures. “Visitors” and “pageviews” are not interchangeable denominators.
It would be tempting to multiply the September rate until it reaches $500. That would imply roughly 49,000 monthly pageviews if every future pageview earned at exactly that rate. The arithmetic is fine; the forecast is not. Rates can change with audience geography, ad inventory, season, device, consent, number of pages per visit and the monetization setup. This account gives none of the detail needed to hold those conditions fixed.
A second trap is to treat revenue as profit or site value. The $6.33 figure is reported earnings for one month. It does not deduct writing, outsourced content, hosting, software, maintenance or the cost of the compromised-site incident. The original $17,500 sale target depended on a proposed multiple of monthly income, not a buyer’s offer. No sale, margin or sustained $500 month is documented in the published report.
The September reversal is therefore a better teaching example than the target valuation. One month’s pageviews rose while earnings fell, showing directly that the two series need to be inspected separately. The reason is unknown. A responsible update would publish the ad dashboard’s period, currency and definition of earnings alongside the analytics period, then explain any known exclusions or timing differences.
What “passive” meant during this test
In the July update, Pejstrup said he worked extra clinic hours and took a two-week holiday while the site continued to attract traffic and earn a little. The monthly table lists 311 pageviews and $5.10 of earnings for July. That is an observation about one relatively quiet period, not evidence that the website could run indefinitely without work or that the original production effort had paid for itself.
He acknowledged this distinction in the source: getting the site to that point took work, and keeping it healthy would still require maintenance. The article does not disclose how long the first 64 posts took to research, commission, edit or upload. It also does not show what happened to the site in subsequent years. Any claim about durable passive income would need both the later revenue series and a tally of the work required to sustain it.
For a reader considering a similar project, separating cash flow from labour is more useful than debating the word “passive.” Record monthly revenue, cash expenses, hours spent on content, hours spent on technical upkeep and any one-off disruptions. A site can earn while its owner is away for two weeks and still be a poor return on the months invested before that holiday.
How to run a more readable small-site test
Start with one question that can actually be measured. “Can I build an income site?” bundles together demand, search visibility, editorial quality, ad yield and costs. “Do articles selected by method A receive more search clicks than comparable articles selected by method B after 90 days?” is narrower. It still needs enough pages and similar topics to be informative, but at least the result has a defined unit and time window.
Next, keep a simple page-level log before publishing: proposed reader question, selection method, publication date, author or production hours, major updates and any paid promotion. Then export Search Console impressions and clicks for those URLs on a repeatable schedule. Count analytics pageviews separately, with the same date range and a note about known bot traffic or measurement changes. Google’s own explanation of Search stages helps prevent “indexed” from becoming a substitute for “found by readers.”
Do not optimise the project for a keyword formula at the expense of the answer. Google’s current guidance asks whether the content helps a visitor directly and provides original information, analysis or experience. That is guidance, not proof that every helpful article will rank. In a small test, keeping a record of what each article uniquely answers makes later traffic figures more interpretable than counting posts alone. Google guidance on people-first content
Finally, define a stopping or revision point before viewing the results. If a cohort has impressions but few clicks, inspect whether titles and snippets match the question. If there are clicks but no meaningful engagement, inspect whether the page delivers what it promised. If traffic grows while earnings do not, inspect monetization separately. These are diagnostic questions, not automatic prescriptions: the data must support a change before the next experiment begins.
What this case cannot settle
The public report ends with its “How much money did I make?” and “What I learned” sections still marked pending. We can account for the nine monthly table entries, but not the full lifetime income, total costs, page-level outcomes or eventual fate of the site. The author’s six keyword-method groups have no published comparative result. We cannot infer that a particular method, domain choice or publishing cadence won.
The analytics references are also historical. The source shows Universal Analytics screenshots from 2022; Google says standard Universal Analytics properties stopped processing new data in July 2023. Someone recreating this tracking today must use a current measurement setup and should not compare modern GA4 metrics with old Universal Analytics screenshots as though the two systems had identical definitions.
That leaves a measured conclusion. The published case shows a site moving from almost no reported pageviews to hundreds per month and from no reported revenue to single-digit monthly earnings during its first nine months. It does not show an established business or prove a formula for starting one. Its enduring value lies in the visible distance between an ambitious forecast and the first actual measurements—and in the questions the missing data force a careful reader to ask. Google Analytics on Universal Analytics sunset